The 2025 Homeowners Renovation Survey provides a snapshot of generational differences in home renovation planning and priorities.
- > Gen Z: Born roughly between 1997 and 2012. Our survey focus on those between 19 to 28 years old (Gen Z Home Renovations Research).
- > Millennials (Gen Y): Born approximately between 1981 and 1996. As of 2025, they are approximately 29 to 44 years old (Millenials Home Renovations Research).
- > Gen X: Born roughly between 1965 and 1980. As of 2025, they are approximately 45 to 60 years old. (Gen X Home Renovation Research)
- > Boomers (Baby Boomers): Born approximately between 1946 and 1964. As of 2025, they are approximately 61 to 79 years old. (Boomers Home Renovations Research)
Generational Home Renovation Priorities
Homeowners at different life stages have different priorities for home remodel. This is generally true across all states in the country.
Planning:
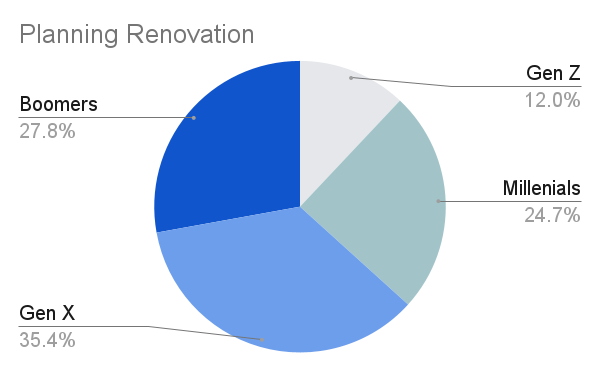
- Overall, about 43% of homeowners are planning renovations. Gen X shows the highest planning rate (56%), suggesting a strong interest in updating their homes, while Gen Z is the least likely to plan renovations (19%).
Improved Living:
- A significant majority (42%) of homeowners prioritize improving their living spaces. This priority is especially strong among Boomers (45%) and Gen X (49%) who are ahead in life and want to enjoy their home.
Higher Sell Price:
- Renovations aimed at increasing the home’s sell price are less common, with an average of 12%. Gen Z (19%) shows the highest interest in this aspect, while Boomers (8%) are the least focused on it.
Bigger Family:
- About 18% of homeowners plan renovations to accommodate a bigger family. Millennials (29%) and Gen Z (26%) are more inclined to renovate for family expansion compared to other generations.
Living in Longer:
- A notable portion (30%) of homeowners plan renovations to extend their stay in their homes. Boomers (44%) are the most focused on this aspect, likely due to their longer-term plans.
Room Addition:
- The average interest in adding an extra room to their home is relatively low at 13% but it makes sense since it’s a big endeavor. Gen X has the highest percentage (22%) for this upgrade type, indicating a preference for adding functional spaces probably instead of buying a bigger home.
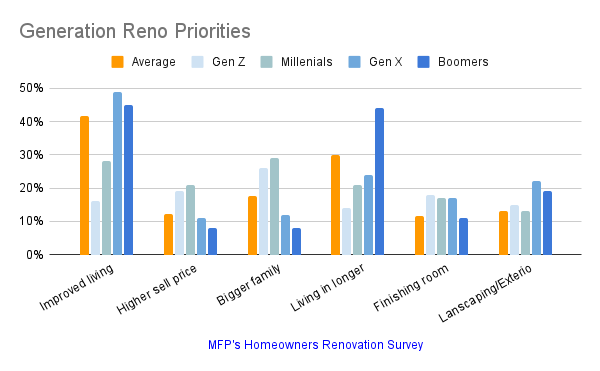
In summary, while improving living conditions is a top priority across all generations, motivations for renovations vary. Gen X tends to focus on long-term stay and functional updates, Millennials and Gen Z are more inclined towards family-related changes, and Boomers prioritize home longevity.
|
Planning Renovations |
Improved Living | Higher Sell Price | Bigger Family | Living in Longer | Room Addition |
Landscaping Exterior |
|
|---|---|---|---|---|---|---|---|
| Average | 43% | 42% | 12% | 18% | 30% | 12% | 13% |
| Gen Z | 19% | 16% | 19% | 26% | 14% | 18% | 15% |
| Millennial | 39% | 28% | 21% | 29% | 21% | 17% | 13% |
| Gen X | 56% | 49% | 11% | 12% | 24% | 17% | 22% |
| Boomers | 44% | 45% | 8% | 8% | 44% | 11% | 19% |
Source: MFP 2025 Homeowners Renovations Survey.
Types of Home Renovations Preferred by Generation
The data illustrates the preferred types of home renovations across different generations and their life stages.
Kitchen Renovations:
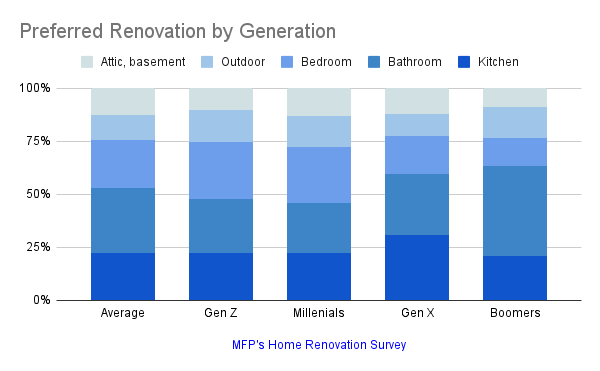
- The average preference for kitchen renovations is 21%, the 2nd highest preference among projects. Gen X shows the highest preference (36%), while Gen Z shows the lowest (15%) for kitchens remodels.
Bathroom Renovations:
- Bathroom renovations are the most popular overall, with 29% of homeowners prioritizing them. Boomers have the strongest preference (38%).
Bedroom Renovations:
- Bedroom upgrades are chosen by 21% of homeowners on average. Millennials exhibit the highest interest (26%) due to the lower upgrade cost.
Outdoor Improvements:
- Outdoor Improvements are the least preferred, with an average of 11%. Millennials show the highest interest (14%).
Attic/Basement Renovations:
- Attic and basement renovations are favored by 12% of homeowners. Gen X has the highest interest in these areas (14%) which provides a big bang for the cost, mostly since they’re looking to add another room.
Bathroom and kitchen renovations are the most popular, with bathroom updates being the top priority. Preferences for bedroom and attic/basement renovations vary, while outdoor renovations are less commonly prioritized but still popular for their lower cost improvements.
| Kitchen | Bathroom | Bedroom | Outdoor | Attic, Basement | |
|---|---|---|---|---|---|
| Average | 21% | 29% | 21% | 11% | 12% |
| Gen Z | 15% | 17% | 18% | 10% | 7% |
| Millennial | 22% | 23% | 26% | 14% | 13% |
| Gen X | 36% | 33% | 21% | 12% | 14% |
| Boomers | 19% | 38% | 12% | 13% | 8% |
Source: MFP 2025 Homeowners Renovations Survey.
Renovation Costs by Generation and Project Type
The survey data highlights the preferred types of home renovations across different generations:
Kitchen Renovations:
- On average, 21% of homeowners prefer kitchen renovations. Gen X leads in this category with 36%, showing a strong preference for updating kitchens, while Gen Z shows the least interest (15%).
Bathroom Renovations:
- Bathroom renovations are the most popular overall, with 29% of homeowners prioritizing them. Boomers have the highest interest (38%), indicating a significant focus on upgrading this space.
Bedroom Renovations:
- Bedroom renovations are chosen by 21% of homeowners on average. Millennials have the highest preference (26%), suggesting they place a notable emphasis on enhancing their bedroom spaces.
Outdoor Renovations:
- Outdoor renovations are the least popular, with an average of 11%. Millennial homeowners have the highest interest (14%) in outdoor spaces, while Gen Z shows the least preference (10%).
Attic/Basement Renovations:
- Renovations for attics and basements are chosen by 12% of homeowners. Gen X has the highest interest (14%) in these areas, while Gen Z shows the lowest (7%) probably due to the fact a smaller percentage of them have homes yet.
Preferences for home renovations vary, with kitchen and bathroom renovations being the most popular overall. Gen X focuses more on kitchen and attic/basement updates, Millennials favor bedroom and outdoor improvements, and Boomers prioritize bathroom renovations.
| Average | Kitchen | Bathroom | Bedroom | Outdoor | Attic, Basement | Energy Efficiency | Home Updated | |
|---|---|---|---|---|---|---|---|---|
| Average | $6,800 | $18,720 | $13,380 | $1,300 | $1,900 | $6,300 | $4,100 | $6,600 |
| Gen Z | $4,100 | $4,500 | $4,200 | $900 | $1,200 | $4,000 | $5,100 | $3,300 |
| Millennial | $6,100 | $8,100 | $7,300 | $1,000 | $1,300 | $5,400 | $5,200 | $4,000 |
| Gen X | $13,400 | $28,400 | $15,800 | $2,100 | $2,200 | $7,300 | $3,900 | $6,400 |
| Boomers | $16,600 | $24,800 | $17,000 | $1,900 | $2,600 | $9,200 | $2,100 | $7,200 |
Source: MFP 2025 Homeowners Renovations Survey.
How Each Generation Funds Their Home Renovations
The Survey data shows how different generations fund their home renovations. It is important to note, most homeowners use more than one way to fund their renovations:
Savings:
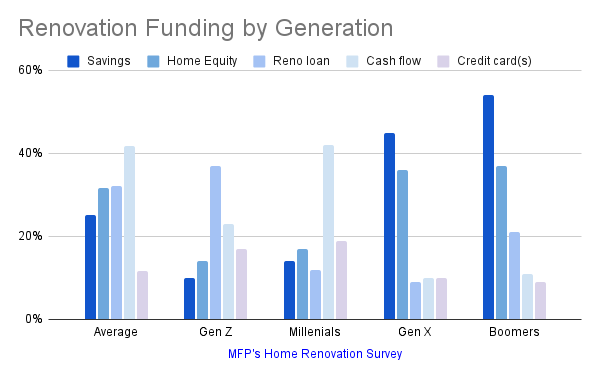
- On average, 25% of homeowners use savings for renovations. Boomers are the most likely to fund renovations this way (54%), while Gen Z relies the least on savings (10%).
Home Equity:
- Home equity is used by 32% of homeowners on average. Boomers (37%) and Gen X (36%) are more inclined to tap into home equity compared to Millennials (17%) and Gen Z (14%).
Renovation Loan:
- Renovation loans are utilized by 32% of homeowners. Gen Z shows the highest reliance on these loans (37%), whereas Gen X prefers other funding methods (9%).
Cash Flow:
- Cash flow is the most common method, with 42% of homeowners using it. Millennials and Gen Z both heavily rely on cash flow (42% and 23%, respectively), while Gen X and Boomers use it less (10% and 11%, respectively).
Credit Card(s):
- On average, 12% of homeowners use credit cards for renovations. Gen Z is the most frequent user of credit cards for this purpose (17%), while Boomers use them the least (9%).
In summary, savings and home equity are significant sources of funding for home renovations, especially for Boomers and Gen X. Renovation loans and cash flow are also popular, with Gen Z showing a higher tendency for loans and credit cards since they have less accumulated wealth than older generations .
| Savings | Home Equity | Reno Loan | Cash Flow | Credit Card(s) | |
|---|---|---|---|---|---|
| Average | 25% | 32% | 32% | 42% | 12% |
| Gen Z | 10% | 14% | 37% | 23% | 17% |
| Millennial | 14% | 17% | 12% | 42% | 19% |
| Gen X | 45% | 36% | 9% | 10% | 10% |
| Boomers | 54% | 37% | 21% | 11% | 9% |
Source: MFP 2025 Homeowners Renovations Survey.
Related Research
Homeowners Renovations Survey 2024